Todd Smith, Anustubh Agnihotri, and I have put together a new resource of subnational education and infrastructure access indicators for Africa, released as part of the Climate Change and Africa Political Stability (CCAPS) program at the University of Texas. This dataset provides data on literacy rates, primary and secondary school attendance rates, access to improved water and sanitation, household access to electricity, and household ownership of radio and television. The new CCAPS dataset includes data for 38 countries, covering 471 of Africa’s 699 first-level administrative districts.
We have used the education indicators and access to improved water source data in the construction of our composite index on climate security vulnerability in Africa, featured in International Security and recently updated on our website. We wanted to make these and a wider set of infrastructure indicators available. The data, the codebook, and shape files for the sub-national units we created for the dataset are available for download. For users of ArcGIS, each entry in the CSV file has a unique ID code that corresponds to a shapefile so you can join the csv file to map indicators of interest. You can also use the csv file for statistical analysis, though you may want to use national data for the other countries for which subnational data is not available.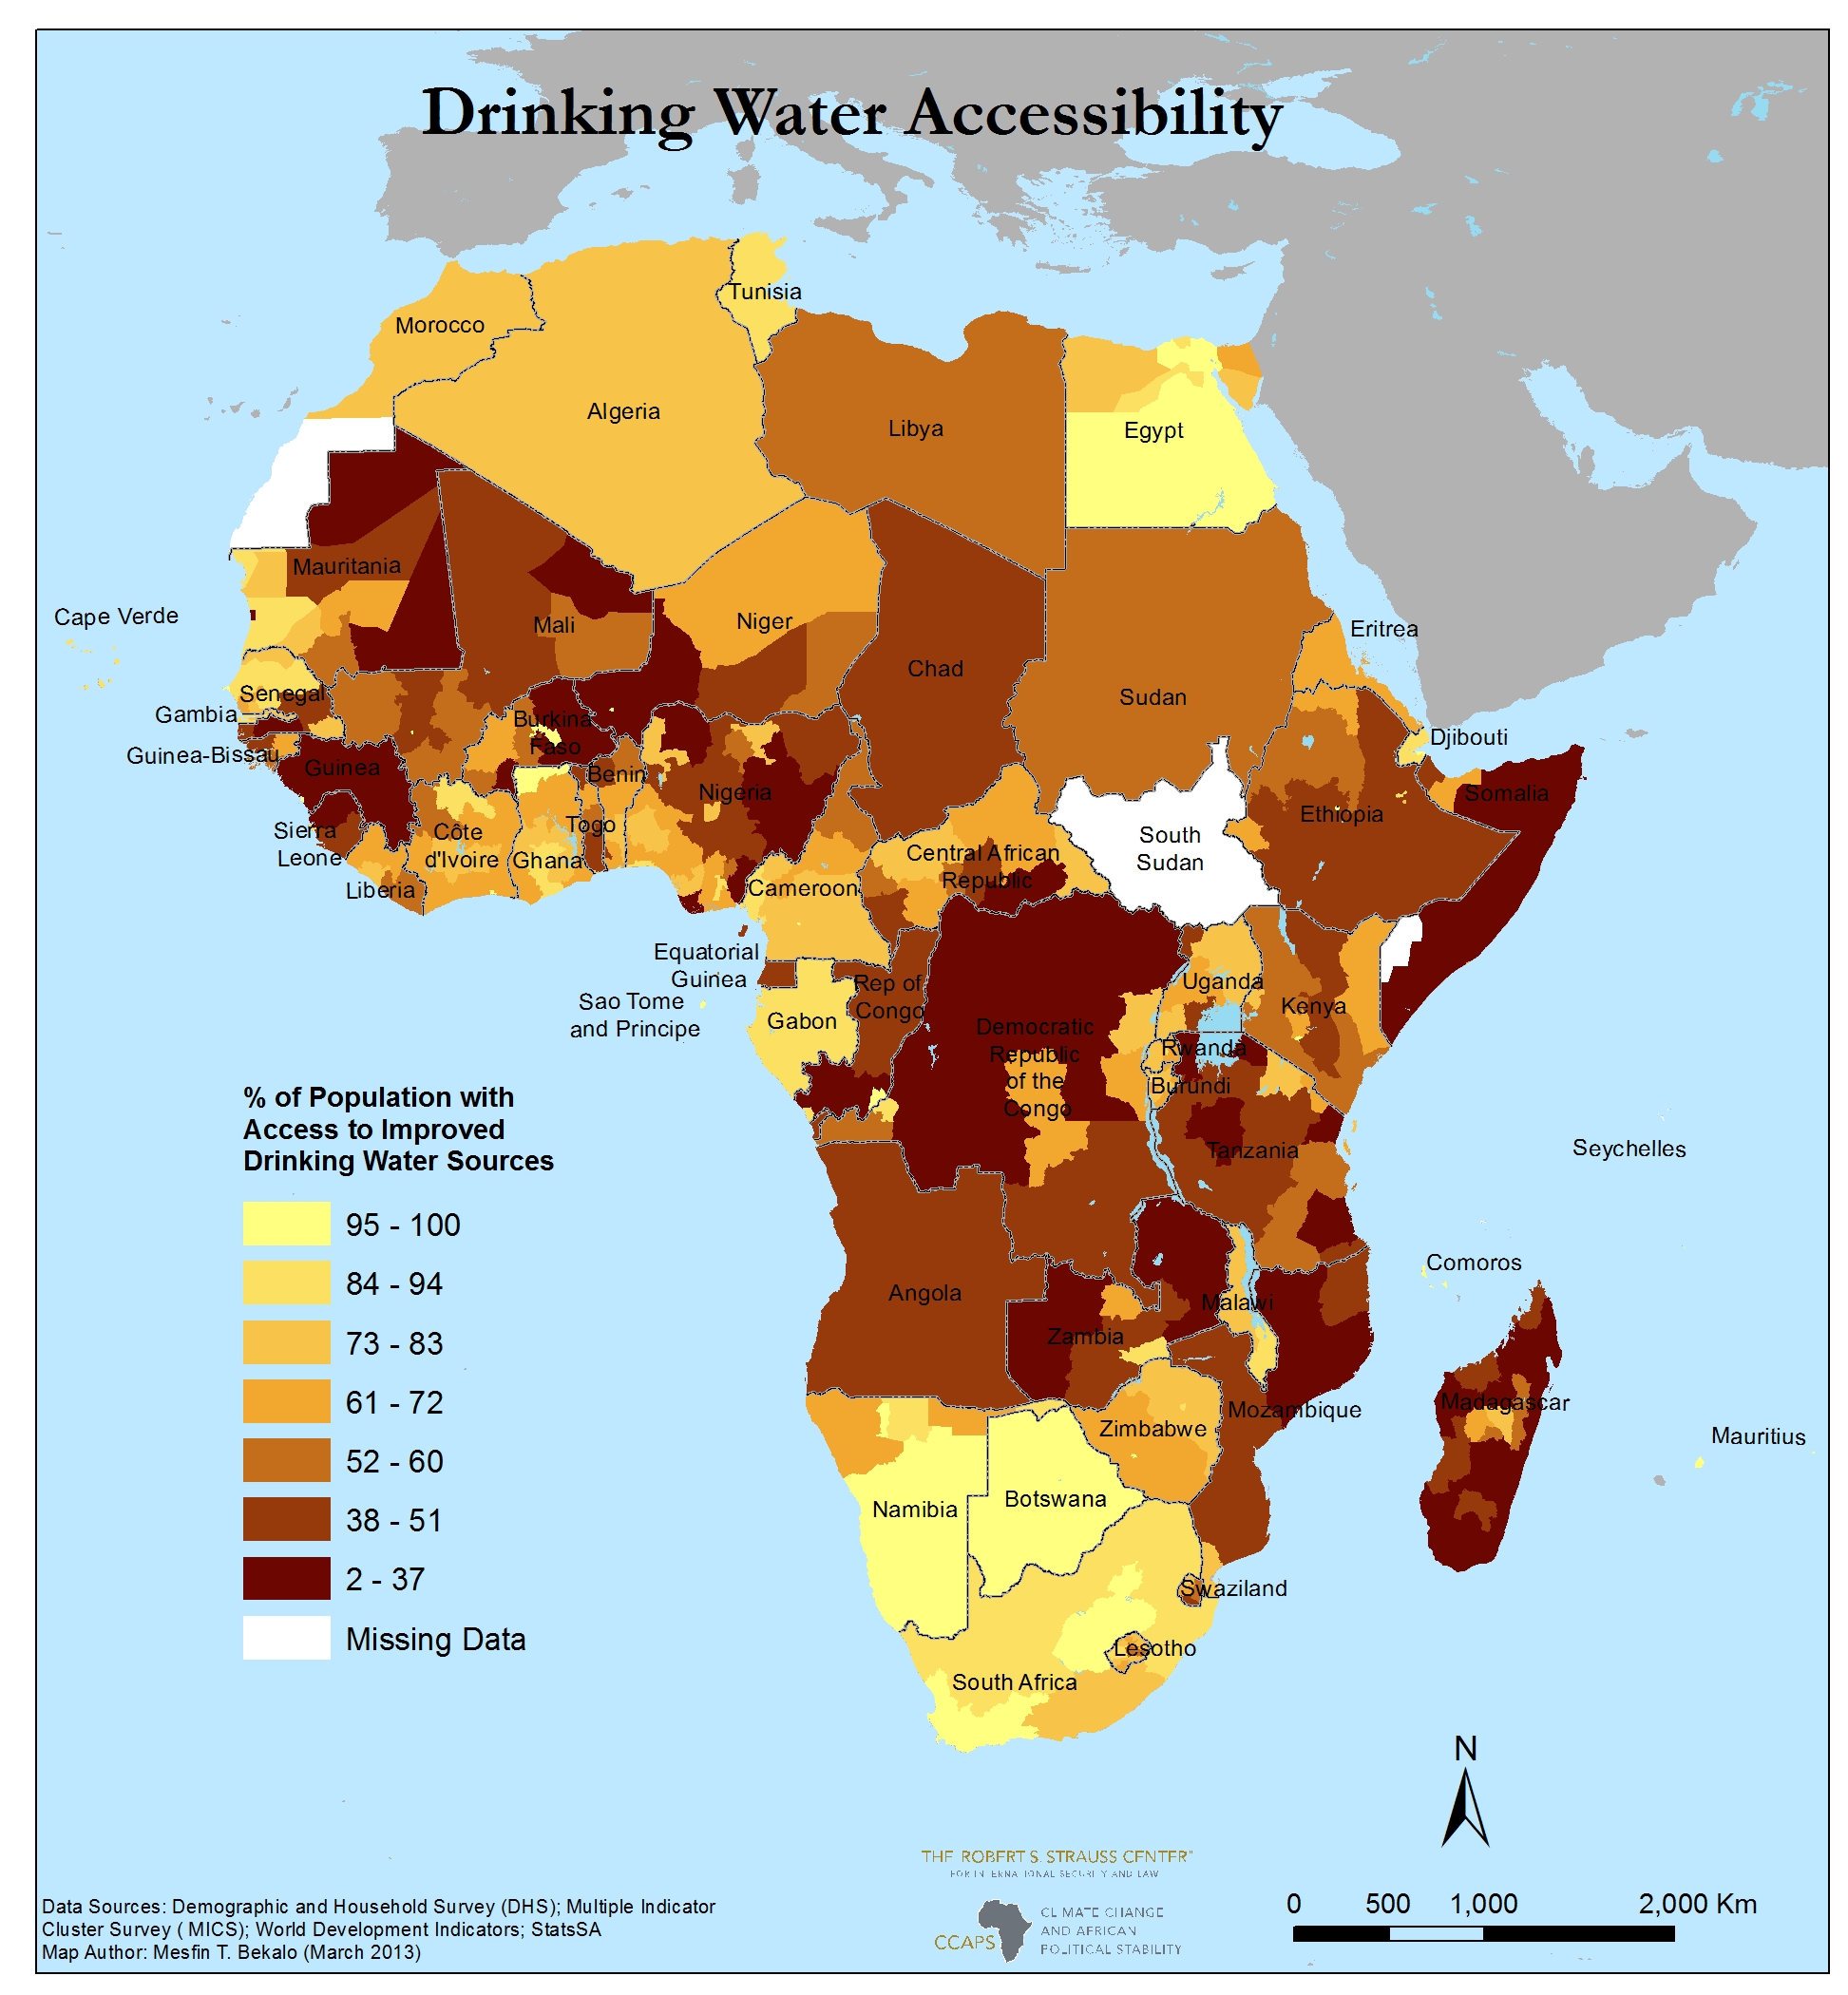
The data were calculated using raw survey data from three sources: the Demographic and Health Surveys (DHS) supported by the U.S. Agency for International Development; Multiple Indicator Cluster Survey (MICS) supported by UNICEF; and the General Household Surveys conducted by Statistics South Africa. For the maps in this post, we also include national level data for countries for which DHS, MICS, or StatsSA data are not available. You start to see the subnational variation in places like Ethiopia and Kenya where the rural eastern regions have much lower literacy rates and in Madagascar where widespread access to improved water sources is confined to the areas around the capital city.
If you read the Journal of Peace Research or the Journal of Conflict Resolution, you have probably noticed an increase in more fine-grained subnational statistical work on the causes and correlates of violence at the local level. One of the limits of such work is that indicators potentially relevant for analysis are often unavailable, particularly for Africa where a “shatter belt” of violence continues over swathes of the continent (even as much of Africa experiences accelerating economic growth).
While some subnational indicators of GDP are available from William Nordhaus, my look at the country files for G-Econ suggests coverage for 26 countries. While the subnational indicators released here for 38 indicators will not correlate perfectly with income, they do help researchers get at some of the subnational living standards that are relevant for a host of topics of concern to political scientists, including but not limited to violence.
One of the limitations is that this dataset represents a snapshot for these subnational units for a single year and, given the way the data is collected, not the same year for all the countries. This means that longitudinal analysis is not yet possible. Nonetheless, we hope that this data proves useful and a prelude to more subnational panel data for Africa and beyond.

Joshua Busby is a Professor in the LBJ School of Public Affairs at the University of Texas-Austin. From 2021-2023, he served as a Senior Advisor for Climate at the U.S. Department of Defense. His most recent book is States and Nature: The Effects of Climate Change on Security (Cambridge, 2023). He is also the author of Moral Movements and Foreign Policy (Cambridge, 2010) and the co-author, with Ethan Kapstein, of AIDS Drugs for All: Social Movements and Market Transformations (Cambridge, 2013). His main research interests include transnational advocacy and social movements, international security and climate change, global public health and HIV/ AIDS, energy and environmental policy, and U.S. foreign policy.

Josh, this is badass. Lots of work and very valuable for folks doing sub-national work! We need more of this so that we can mash with other sub-national data. Is there a paper associated, or if not a paper, then can you hum a few bars on what you found/what is surprising? I was just glancing at the map and it makes crystal clear that our normal cross national datasets on educational outcomes (or anything else) hide so much variation. There is dramatic variation even in small countries. Wondering what else you guys found and/or what you plan to do with these data. Thanks. Mike
Mike,
Thanks for your comment. We’ve used this data as part of our household and community resilience basket in our composite index of climate change vulnerability that’s just come out as a brief as part of the CCAPS project. Some of the aggregate maps at the basket level are here.
https://ccaps.aiddata.org/buildingthemodel
Because we were interested in the aggregate patterns of vulnerability, we haven’t yet done much at the individual indicator level, though we are actively trying to evaluate how improvements in one indicator might change a region’s overall composite vulnerability score. So, if you knew that eastern Kenya had low literacy, how would it’s overall vulnerability score improve if you were to invest in education? To the extent that improvements in the index would indeed improve adaptive capacity on the ground, this approach might be a helpful way to think about interventions, though one would want to be careful about reading too much into the power of the index.
We would certainly be open to other applications, either in concert with others or other scholars taking the data and running with it.